S Curve Project Management adalah Visualisasi Grafis Kemajuan suatu Proyek dari Waktu ke Waktu
S Curve Project Management adalah Visualisasi Grafis Kemajuan suatu Proyek dari Waktu ke Waktu
Sebuah penelitian menunjukkan bahwa hampir 70% proyek mengalami keterlambatan dan pemborosan anggaran. Dalam konteks manajemen proyek, S Curve Project Management menjadi solusi efektif. Ini memungkinkan pemantauan dan analisis kemajuan secara grafis dari waktu ke waktu. Dengan visualisasi kemajuan proyek yang jelas, manajer proyek dapat dengan mudah mengevaluasi kinerja proyek. Mereka juga dapat mengidentifikasi potensi masalah sebelum menjadi besar.
Implementasi manajemen proyek berbasis Kurva S memberikan keuntungan besar. Perusahaan dapat mengambil keputusan yang lebih informasi dan memperbaiki komunikasi antar pemangku kepentingan. Metode ini sangat efektif dalam memastikan proyek tetap berada dalam batas anggaran dan jadwal yang telah ditentukan. Ini meningkatkan peluang keberhasilan proyek secara keseluruhan.
Kurva S dalam Manajemen Proyek
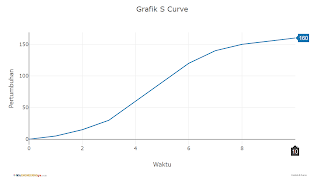
Kurve S adalah alat penting dalam manajemen proyek kurva S, yang digunakan untuk menggambarkan kemajuan proyek melalui waktu. Dengan memanfaatkan kurva ini, manajer proyek dapat membandingkan total pekerjaan yang diselesaikan dengan waktu yang telah berlalu. Grafik kurva S menunjukkan pergerakan lambat di awal proyek, lalu meningkat pesat seiring dengan progres.
Pentingnya pengenalan kurva S dalam manajemen proyek tidak dapat diabaikan. Konsep dasar kurva S membantu dalam merencanakan dan menjadwalkan aktivitas proyek. Ini memberikan panduan visual yang jelas tentang status perkembangan proyek. Manajer proyek yang memahami kurva ini dapat mengambil langkah proaktif untuk mengatasi tantangan yang mungkin muncul.
Dengan memahami konsep dasar kurva S, tim proyek dapat memprediksi kapan pekerjaan akan selesai dan membandingkan target dengan realisasi. Ini sangat berguna untuk meningkatkan efektivitas, efisiensi, dan akurasi dalam pengelolaan proyek.
Definisi dan Konsep Dasar Kurva S
Definisi kurva S menggambarkan kemajuan proyek melalui waktu. Ini menunjukkan apa yang telah diselesaikan dan apa yang akan datang. Kurva ini penting untuk memahami rencana dan proyeksi masa depan.
Konsep manajemen proyek terkait erat dengan kurva S. Ini membantu dalam mengelola sumber daya dan menetapkan tenggat waktu. Kurva S dibagi menjadi tiga fase utama:
- Fase Persiapan: Perencanaan dan pengaturan awal.
- Fase Eksekusi: Pelaksanaan proyek berlangsung.
- Fase Penyelesaian: Menyelesaikan tugas dan mengevaluasi hasil.
Memahami fase-fase ini penting untuk mengidentifikasi risiko. Ini memungkinkan manajer proyek mengatur sumber daya dengan lebih baik. Ini meningkatkan efisiensi dan efektivitas proyek.
| Fase Proyek | Deskripsi | Tujuan Utama |
|---|---|---|
| Fase Persiapan | Perencanaan sumber daya dan penjadwalan. | Menentukan garis waktu dan anggaran proyek. |
| Fase Eksekusi | Pelaksanaan pekerjaan sesuai rencana. | Mencapai kemajuan sesuai target. |
| Fase Penyelesaian | Penyelesaian dan evaluasi hasil proyek. | Mengumpulkan feedback dan melakukan tindak lanjut. |
Memahami kurva S dan konsep manajemen proyek penting. Ini memastikan proyek berjalan lancar dan hasil yang memuaskan.
Manfaat S Curve Project Management
S Curve Project Management menawarkan berbagai manfaat yang signifikan bagi manajer proyek dan tim terkait. Memanfaatkan kurva S memungkinkan pengelolaan proyek yang lebih terstruktur dan terukur. Hal ini pada akhirnya dapat meningkatkan efisiensi dan efektivitas dalam pelaksanaan proyek.
Pengendalian Proyek yang Lebih Efektif
Manfaat kurva S sangat terasa dalam pengendalian proyek. Dengan visualisasi yang jelas, manajer dapat dengan mudah menilai apakah proyek berjalan sesuai rencana atau tidak. Pengendalian proyek yang lebih efektif dicapai melalui analisis berkala terhadap kurva S, yang memberikan informasi langsung mengenai kemajuan dan kelemahan.
Langkah-langkah yang tepat dapat diambil untuk menjaga proyek tetap pada jalurnya. Misalnya, dengan melakukan penyesuaian sumber daya atau jadwal.
Pemantauan Kemajuan Secara Real-time
Dengan pemantauan kemajuan proyek yang berbasis kurva S, tim proyek dapat melakukan pembaruan secara teratur. Hal ini memungkinkan mereka untuk melihat status terkini dan beradaptasi dengan cepat terhadap perubahan yang diperlukan. Penggunaan data secara real-time membantu mengurangi risiko penundaan dan meningkatkan kejelasan mengenai langkah-langkah selanjutnya.
Penting untuk memastikan semua anggota tim memiliki akses terhadap informasi ini. Hal ini meningkatkan kolaborasi dan komunikasi.
| Aspek | Manfaat Kurva S | Contoh Penerapan |
|---|---|---|
| Pengendalian Proyek | Memfasilitasi peninjauan berkala | Evaluasi bulanan terhadap kemajuan proyek |
| Pemantauan Kemajuan | Menyediakan data terkini untuk keputusan cepat | Pembaruan mingguan dalam rapat tim |
| Risiko | Identifikasi lebih awal terhadap potensi masalah | Analisis penyimpangan kurva S dari jadwal awal |
S Curve Project Management: Alat Visualisasi Utama
Dalam ranah manajemen proyek, kurva S sebagai alat memegang peranan krusial sebagai alat visualisasi utama. Alat ini mempresentasikan data kemajuan proyek dengan cara yang intuitif. Representasi visual ini memungkinkan tim dan pemangku kepentingan mengidentifikasi status proyek secara cepat dan akurat.
S Curve Project Management memfasilitasi manajer proyek untuk mengidentifikasi segera apakah proyek berjalan sesuai dengan rencana atau mengalami kendala. Dengan mengadopsi manajemen proyek S curve, tim dapat melakukan penyesuaian strategis berdasarkan informasi terkini yang disajikan melalui kurva S.
Secara keseluruhan, alat visualisasi ini tidak hanya mempercepat proses pemahaman, tetapi juga memperkuat komunikasi antar pihak. Penggunaan kurva S sebagai alat visualisasi memberikan keunggulan signifikan dalam pengendalian proyek. Ini memastikan setiap tahapan proyek terpantau dengan teliti.
Analisis Kurva S Proyek
Analisis kurva S proyek merupakan alat penting dalam penilaian kemajuan suatu proyek. Proses ini melibatkan penggunaan data analisis proyek yang sistematis untuk mengevaluasi apakah proyek berjalan sesuai dengan rencana anggaran dan jadwal. Melalui analisis ini, manajer dapat mengidentifikasi potensi masalah dan mengambil tindakan yang diperlukan untuk menjaga proyek tetap pada jalurnya.
Penggunaan Data untuk Analisis
Data yang terkumpul sepanjang siklus hidup proyek menjadi dasar untuk analisis kurva S. Penggunaan data analisis proyek memungkinkan evaluasi yang lebih mendalam tentang kinerja. Dengan menganalisis data dari berbagai sumber, manajer proyek dapat mendapatkan gambaran yang jelas tentang progres dan hambatan yang dihadapi.
Menentukan Kinerja Proyek Melalui Kurva S
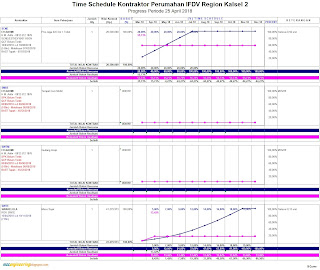
Kurva S memberikan informasi visual yang memudahkan dalam menentukan kinerja proyek melalui kurva S. Dengan mengikuti pergerakan kurva, manajer dapat menilai apakah proyek berjalan sesuai rencana. Jika terdapat deviasi, strategi dapat disesuaikan untuk meningkatkan efisiensi dan memastikan proyek tetap on track.
Implementasi Kurva S dalam Proyek
Untuk sukses, implementasi kurva S dalam proyek membutuhkan strategi yang matang. Langkah awal adalah menetapkan sasaran proyek dengan jelas. Tim harus mengidentifikasi tujuan jangka pendek dan panjang serta menentukan indikator kinerja yang relevan. Selanjutnya, penting untuk mengumpulkan data yang relevan, termasuk estimasi waktu dan biaya.
Langkah berikutnya adalah memilih perangkat lunak manajemen proyek yang sesuai. Alat ini membantu tim dalam menciptakan kurva S yang akurat, yang merefleksikan kemajuan aktual. Penggunaan perangkat lunak yang efektif mempermudah pemantauan kinerja dan memungkinkan deteksi perubahan jadwal atau anggaran dengan cepat.
Di tahap selanjutnya, pengelolaan proyek kurva S fokus pada pemantauan dan pengendalian kemajuan. Dengan analisis data yang akurat, tim dapat merespons perubahan dengan cepat. Visualisasi data melalui kurva S memungkinkan pemangku kepentingan untuk memahami gambaran proyek secara keseluruhan. Ini membantu dalam pengambilan keputusan tentang alokasi sumber daya dan penyesuaian jadwal. Sukses dalam implementasi kurva S mendukung pencapaian hasil proyek yang diinginkan.
Software Kurva S untuk Manajemen Proyek
Pemilihan software yang tepat dalam manajemen proyek sangat penting untuk keberhasilan. Banyak software manajemen proyek kurva S yang tersedia, masing-masing dengan kelebihan dan fitur yang sesuai dengan kebutuhan proyek. Ini memungkinkan optimasi penggunaan kurva S.
Pilihan Software Terbaik
Beberapa software kurva S terkemuka dalam industri manajemen proyek adalah:
| Nama Software | Fitur Utama | Kelebihan |
|---|---|---|
| Microsoft Project | Pemodelan Kurva S, Pelaporan Kemajuan | Kemudahan integrasi dengan produk Microsoft lainnya |
| Primavera P6 | Analisis Data Proyek, Pemantauan Real-time | Kemampuan menangani proyek berskala besar |
| Smartsheet | Kolaborasi Tim, Visualisasi Proyek | Antarmuka pengguna yang intuitif |
| Trello | Kolaborasi Tim, Visualisasi Tugas | Tim Kreatif, Pengembang Perangkat Lunak |
Memilih software manajemen proyek kurva S yang tepat mendukung tim dalam memantau proyek. Software ini memungkinkan manajer proyek meningkatkan efisiensi dan memastikan proyek berjalan sesuai rencana. Penting memilih software yang sesuai dengan kebutuhan dan tujuan proyek.
Metode Manajemen Proyek Kurva S
Dalam penerapan metode manajemen proyek kurva S, berbagai pendekatan tersedia. Masing-masing metode menawarkan cara khusus untuk mengelola waktu dan sumber daya. Beberapa metode yang sering digunakan termasuk:
- Metode Agile: Pendekatan ini memungkinkan penyesuaian cepat terhadap perubahan, cocok untuk proyek dengan tingkat ketidakpastian tinggi.
- Metode Waterfall: Metode ini memakai fase yang terstruktur dan berurutan, ideal untuk proyek dengan persyaratan jelas dan tidak berubah.
- Critical Path Method (CPM): Metode ini fokus pada identifikasi jalur terpanjang dari kegiatan untuk meminimalkan waktu penyelesaian.
Pemilihan strategi pengelolaan proyek yang tepat sangat penting. Setiap metode memiliki keuntungan kurva S dalam manajemen proyek yang signifikan. Penting untuk memilih metode yang sesuai dengan karakteristik proyek. Ini akan mendukung pengendalian yang lebih baik dan efisiensi dalam penggunaan sumber daya.
Perbandingan S Curve dengan Metode Manajemen Proyek Lainnya
Analisis perbandingan S Curve dengan metode manajemen proyek lain, seperti metode jalur kritis (CPM) dan diagram Gantt, menawarkan perspektif yang signifikan bagi profesional di bidang ini. Metode S Curve menonjol dalam visualisasi kemajuan proyek, memudahkan tim untuk mengikuti perkembangan dari satu periode ke periode lain.
Di sisi lain, penting untuk memahami kelebihan dan kekurangan dari masing-masing metode. S Curve memberikan analisis mendalam tentang waktu dan biaya, yang membuatnya ideal untuk proyek yang membutuhkan pemantauan progres yang intensif. Diagram Gantt, meskipun menawarkan representasi visual yang baik, kurang cepat dalam menyampaikan informasi tentang perubahan selama proyek berlangsung.
Perbandingan beberapa metode manajemen proyek dapat dilihat sebagai berikut:
| Metode | Kelebihan | Kekurangan |
|---|---|---|
| S Curve |
|
|
| Metode Jalur Kritis (CPM) |
|
|
| Diagram Gantt |
|
|
Memilih metode manajemen proyek yang tepat sangat penting, tergantung pada kebutuhan proyek. Setiap metode memiliki kekuatan unik dalam mengelola dan menganalisis aspek proyek, tergantung pada kompleksitas dan tujuan yang ingin dicapai.
Kesimpulan
S Curve Project Management menawarkan solusi efektif dalam manajemen proyek. Pendekatan ini memberikan kontrol yang lebih baik dan memungkinkan pemantauan kemajuan secara real-time. Ini membantu tim proyek untuk tetap fokus pada tujuan mereka.
Analisis mendalam menggunakan data yang tepat memungkinkan evaluasi kinerja proyek secara komprehensif. Ini memungkinkan visualisasi setiap aspek proyek, memfasilitasi pengambilan keputusan yang lebih tepat.
Implementasi manajemen proyek kurva S yang efektif, dengan dukungan perangkat lunak khusus, meningkatkan efisiensi dan efektivitas. Ini sangat penting untuk organisasi yang berfokus pada keberhasilan proyek. Dengan demikian, adopsi pendekatan S Curve sangat direkomendasikan.


